SPODALABOpen platform ↗
KREN
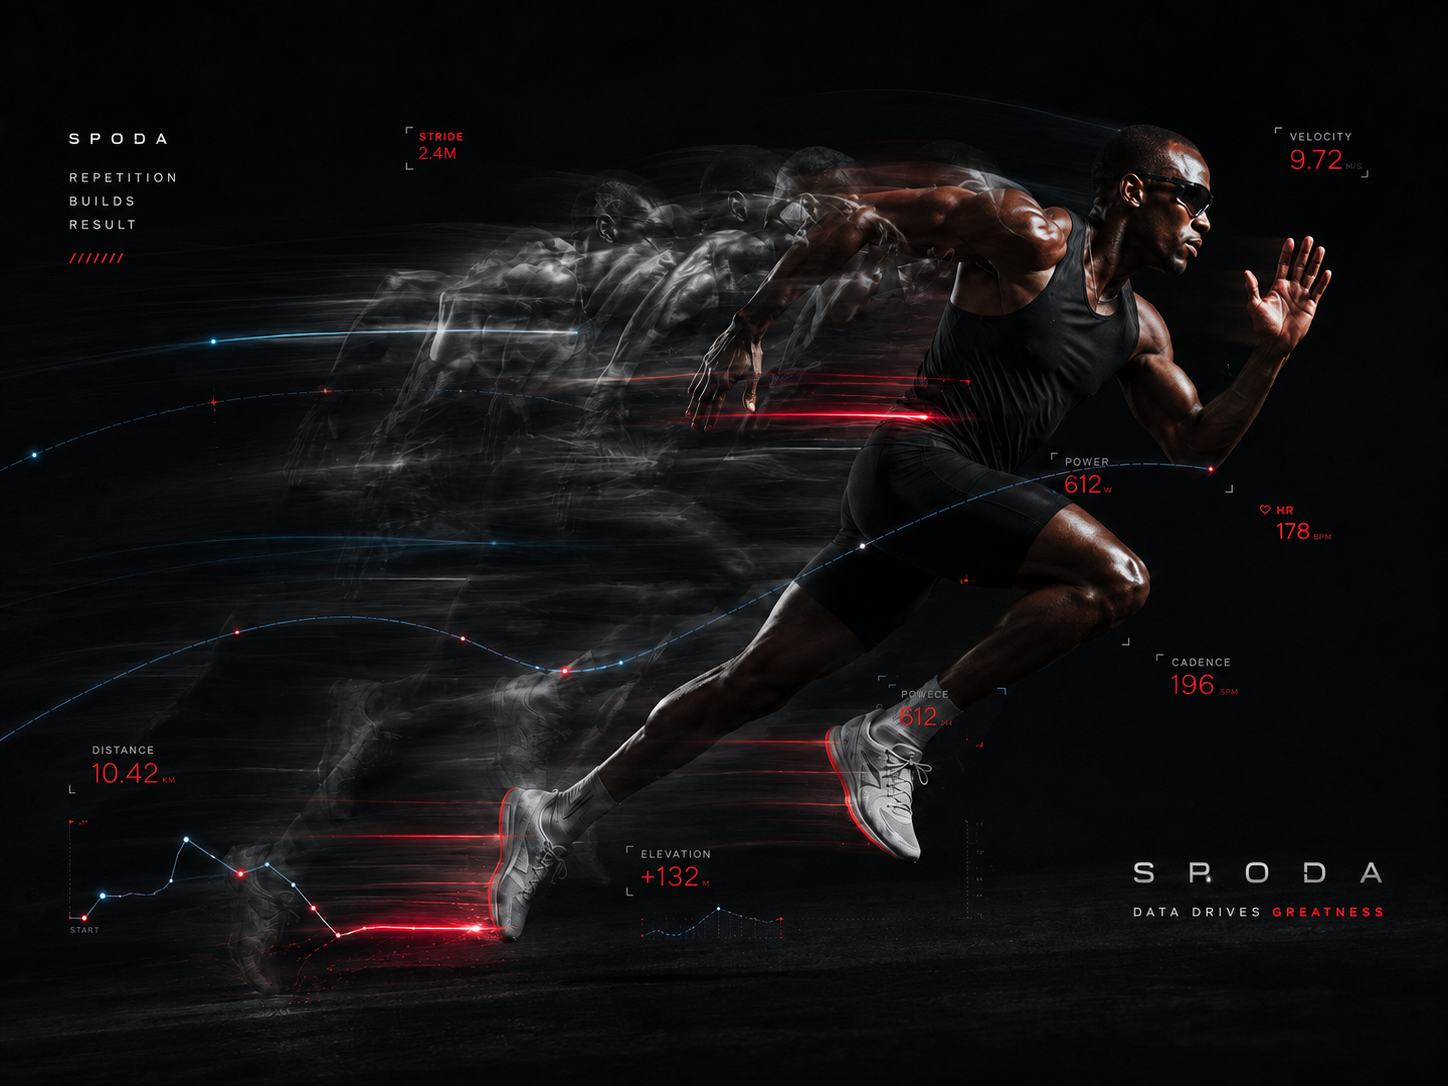
An athlete in motion during training
SPODA

Record movement.
Discover potential.

Sport Performance Optimization
& Data Analytics

Experience SPODA ↗
HEART RATE Heart rate · BPM60 MIN SESSION
1001401800:0015:0030:0045:0060:00
Warm-upIntervals · Recovery × 3Cool-down
Data visualization concept. Not actual measured data.

Scattered records.
One connected view.

Collect. Understand. Apply.

Connected records

Different ways to record. One training context.

WEARABLEFILETRAINING LOG

Training intensity, made visible

A new perspective on time and intensity together.

Patterns to discover

Look beyond one session to the changes building over time.

TRAINING VOLUMETIME →

Consistency
has a pattern.

How often. How long.
The more you record, the clearer your training becomes.

CONSISTENCY MAPTRAIN · REPEAT · DISCOVER
LESSMORE

From numbers to trends.
From trends to the next session.

Change the period to explore another perspective.

SPODATRAINING REPORT

Your training.
The bigger picture.

Illustrative service layout
The figures below are sample data.

PERFORMANCE OVERVIEW

Training report

Training time12.4 h
Sessions8 sessions
Total distance142.6 km
TRAINING VOLUMETraining time
REPEAT × DATA = PERFORMANCEILLUSTRATIVE DATA

Sample data and an illustrative service layout, not an actual platform screen. Check the platform for the availability of each integration and feature.

BETTER DATA.
BETTER DECISIONS.

Open the SPODA platform ↗